


Lighting CRI with i1Profiler and the i1Pro
Lighting CRI measurement with i1Profiler
Using Osram LED ColorCalculator software

No more Google ads. Too many deceptive and irritating adverts.
Any ad links left are non tracking, to companies we know, trust and we've worked with for years [Park Cameras]
Ads helped pay for site running costs, so if you found something useful, please
...Make small KoFi donation?
...Subscribe to Keith's YouTube Channel
...Get Keith's book about how to use tilt/shift lenses
Our site contains affiliate links - these help support the site. See our Advertising policies for more
After looking at some LED lighting, Keith was wondering how to use his i1 spectrophotometer to measure light spectra and obtain CRI values.
This article shows one way Keith combined i1Profiler and the Free LED ColorCalculator software from Osram, to explore some aspects of light sources here at Northlight.

Measuring the CRI of a light source
Years ago, you could use some free Gretag Macbeth software called i1Share to measure light sources, get a spectrum and and a value for the CRI of any light source. It had one of the worst user interfaces I’d come across, but it did some useful things (See more info about 2/3rd of the way down my [2005] i1Design review)
i1Share long ceased running on any of my Macs (V1.4 is still available – X-Rite) and like many other features of X-Rite/GMB software at the time, never quite made it into X-Rite’s i1Profiler package (See my assorted i1Profiler reviews for more info).
CRI?
This is from the i1Share info:
CRI stands for Colour Rendering Index. The CRI indicates how closely a measured light source compares to a standard light source in terms of colour temperature and spectral distribution.
The calculation of the CRI is standardised by the CIE. i1Share lets you know how the CRI for your individual measured light source (e.g. of a light box) compares to a standard light source. A value of 100% is best. A value in the green range is good. [i1Share display]
Be aware that you could have, for instance, two light sources of 5000K, but with different spectral curves. When judging a colour under two light sources with same temperature but different spectral curves, the colours may appear different.
There are many issues with applying a relatively simple CRI value to LED light sources and how cameras (still or video) interpret a scene viewed under a particular light source. My experiments here are just that – I’ve written them up to help people explore more about this subject. For myself they confirm many of my experiences in testing lights and using such tools as the X-Rite ColorChecker Passport for making custom camera profiles for awkward lighting.
Measuring the light
One thing you can do with i1Profiler is measure ambient light spectra with an i1Pro spectrophotometer – you just need the ambient light cover. It just clips on to the measurement end of the spectrophotometer.

This is the i1Pro 2 – there is a similar head available for the older i1Pro. The heads are matched to the spectro for calibration purposes, but a piece of PTFE tape as a diffuser would do at a push (I did say that this was just for experimenting with).
Note PTFE pipe tape is an exceedingly good white, with a very even reflectance spectrum. A roll of it makes for a very simple white balance tool.
Using i1Profiler
In the printer profiling workflow there is an ambient light measurement facility in the ‘Lighting’ section.
This is where you’d select the illuminant to use to build your printer profile.
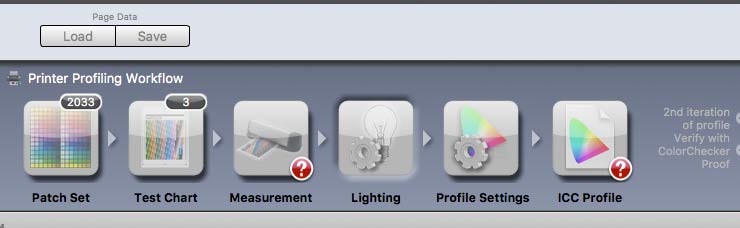
There is however the option to measure a light source (and load saved files). Whilst this allows you to build printer profiles adapted to a specific light source, it’s something I very rarely use in practice.

The spectrophotometer can be used to measure a spectrum (10nm steps) from 380nm to 730nm.
Here’s the simple curve from the very bright halogen uplighter in my office.

At ~500 watt, it is incredibly bright at full power, and absolutely ideal for setting up my fine macro work, where the absence of shadow really helps (it’s also ideal for when I’ve dropped something small). Low energy lighting – yes, I’ve heard of it ;-)
Perhaps more interesting is the colour spectrum of the Kaiser 5850 LED light panel I recently reviewed.

Measuring the LED panel.

The spectrum is typical of better quality LED lighting.
Compare it with my LED torch, with its very obvious blueish light

Or even worse, the cheap energy saving CFL lamp in our hallway.

I’ve a print of a sunset in the hallway – that orange peak in the lighting really makes it glow – it’s less optimal for most other photos though…
i1Profiler lets you save the light measurements in .lxf files, but that’s your lot as far as lighting evaluation.
Using the .lxf files
At this point, I’ve some pretty spectra and measurement files, how to work out the CRI?
It turns out that the maths is quite complex – well at least complex enough to put me off writing code for it (I last wrote any significant software in the early 1990’s).
There are spreadsheets available, but the code won’t run on my Mac: See the CQS paper from NIST and their spreadsheet if you’ve a PC version of Excel
At this point my searches came across some FREE software (Lin,win and Mac) from Osram.
It’s called LED ColorCalculator and can be downloaded at
https://www.osram.us/cb/tools-and-resources/applications/led-colorcalculator/index.jsp
There is a full user guide, and it does vastly more things than I’m going to show here. Its main purpose is for you to be able to develop colour mixing LED lighting solutions.
Opening the software, it’s a bit of a ‘designed by and for engineers’ interface (I used to do usability research/consultancy work before I became a photographer) but isn’t too difficult to follow.

click to enlarge
Under the User Spectra menu is an option to import simple text data.
The .lxf files have the data, but not in a format ColorCalculator can use. So I just copied the data into a new text file, and then into an Excel spreadsheet. I saved this as a tab delimited .txt file and imported it into ColorCalulator.

Yes, I know there are probably vastly more efficient ways to do this, but I’m only doing a few examples.
Once the spectral data is loaded, this info is produced. The software uses 2nm step data, but has fitted my i1Pro2 10nm data in by duplicating values (look at the table to see how). The software asks you to select the measurement units, but that’s not important for this experiment (I ticked the first option).

So, I get a calculated colour temperature of 5579K and a basic 98CRI.
This qualitatively matches the good colour rendition I found in my Kaiser LED panel review.
Let’s have a quick look at that CFL lighting in my hallway…

2335K and an 84 CRI – yes, it’s awful.
Some more reports
As I mentioned, the Osram software does quite a lot.
I’ll just show two IES TM-30-18 colour rendition reports, which give an idea of how well your light source will reproduce various defined colours. (big files click to enlarge)

First the LED panel:

and then the CFL lighting…

Note how the reference model spectra are based on the calculated colour temperature, so in the CFL report the reference (grey line) is similar to my halogen uplighter.
Conclusions and alternatives
I’m sure that there are many easier and better ways of doing this, but it was fun experimenting with the kit I’d already got.
If you’ve alternative ways of using an i1 spectro to get spectral plots and CRI values, please do et me know? (below, or email – note using comments below will block URLs)
More info
- An online CRI generator will work things out for you – it just needs 1 or 2nm steps for the spectral data( from 380-780nm)
https://www.waveformlighting.com/tech/color-rendering-index-calculator - See the CQS paper from NIST and their spreadsheet if you’ve a PC version of Excel
- Working out CRI – https://en.wikipedia.org/wiki/Color_rendering_index
Never miss a new article or review - Sign up for our occasional (ad-free) Newsletter
and please do subscribe to Keith's YouTube Channel

Other areas of our site that may be of interest...
All the latest articles/reviews and photo news items appear on Keith's Photo blog

Keith explains tilt and shift lenses
Keith has written a book that looks at the many ways that tilt/shift lenses can benefit your photography from a technical and creative point of view. If not in the UK check for import issues and maybe try an on-line bookshop. Keith has no connection with sales of the book.
ISBN 9781785007712
There is also a specific index page on the site with links to all Keith's articles, reviews and videos about using tilt and shift.
We've a whole section of the site devoted to Digital Black and White photography and printing. It covers all of Keith's specialist articles and reviews. Other sections include Colour management and Keith's camera hacks - there are over 1200 articles/reviews here...
Adverts removed